|
|
|
|
Home > Articles >Tests and Measurements for the Parent, Teacher, Advocate and Attorney by Peter Wright and Pamela Wright |
|
|
Tests and Measurements for the "If something exists, it exists in
some amount. I. Introduction II. The Process
of Educational Decision-Making III. Statistics:
General Principles IV. Using the Bell Curve to Measure
Progress VI. Parents
"To-Do" List Wrightslaw
Note:
Although this comprehensive article has been revised and updated several times since it was originally published, the basic principles about tests and measurements and the bell curve have not changed. For more information about how to use tests and measurements and the bell curve to measure and monitor a child's progress, please read Chapters 10 and 11 in Wrightslaw: From Emotions to Advocacy, 2nd Edition.
Understanding Your Child's Test Scores by Peter W. D. Wright, Esq. Multimedia Training 1.5 hrs Download
Most parents
of special needs children know that they must understand the law
and their rights. Few parents know that they must also understand
the facts. The "facts" of their child's case are contained in the
various tests and evaluations that have been administered to the child.
Changes in test scores over time provide the means to assess educational
benefit or regression. As an attorney who specializes in representing special education children, many parents consult with me after they decide that their child's special education program is not appropriate. These parents are often right. However, in most cases they do not have the evidence to support their belief, nor do they know how to interpret and use the evidence contained in educational and psychological tests. They need evidence to support their beliefs. These parents are convinced that a special education program is not providing sufficient help for the child --- that under the present special education program, the child is failing to make adequate progress and has fallen further behind. These parents experience a sense of urgency --- the child has usually received special education for several years and time is running out. Critical educational decisions are often based on the subjective beliefs of parents and educators. As a parent, you may believe that your child is not making adequate progress in a special education program. The special education staff may firmly believe that he is doing as well as he can --- or that your expectations are too high. Without objective information, both sides take positions that are based on their emotions --- and tempered by their hopes and fears. Appropriate educational decision-making must be based on objective information and facts, not subjective emotional reactions and beliefs. Before you can participate in the development of an appropriate special education program, you must have a thorough understanding of the child's strengths and weaknesses. This information is contained in tests that are used to measure the child's abilities and educational achievement. Tests administered to children fall into several categories: intellectual or cognitive tests; educational achievement tests; projective personality tests, questionnaires and surveys; speech and language tests; and neuropsychological tests. The United States Supreme Court
In Florence County School District Four v. Shannon Carter, 510 U. S.7, 114 S. Ct. 361, (1993), the Supreme Court issued a landmark decision. In Carter, the school system defaulted on their obligation to provide a free appropriate education to Shannon Carter, a child with learning disabilities and an Attention Deficit Disorder. Let's look at how the courts viewed the facts and the law in the Carter case. Background When Shannon
was in the seventh grade, her parents talked to the public school staff
and expressed their concerns about Shannon's reading and other academic problems.
Shannon was evaluated by a public school psychologist who described her
as a "slow learner" who was lazy, unmotivated and needed to be pressured
to try harder. Her parents pressured her to work harder. In the ninth grade, despite intense
pressure, Shannon failed several subjects.
The school district developed an IEP for Shannon's tenth grade year. This IEP proposed that after a year of special education, Shannon would read at the 5.8 grade equivalent level and perform math at the 6.8 grade equivalent level. In other words, after a full year of special education to remediate her learning disabilities, Shannon was expected to make only four months of progress in reading and math. Progress would be measured by her scores on the Woodcock Reading Mastery and KeyMath educational achievement tests. She would progress from the 5.4 to 5.8 grade level in reading and from the 6.4 to 6.8 grade levels in math. Shannon's parents insisted that their daughter needed a more intensive program so she could learn the necessary reading, writing and math skills. They felt that the proposed program was inadequate, and worried that Shannon would still be functionally illiterate when she graduated from high school three years later. Emory Carter insisted that the school teach his daughter to read, write and do arithmetic at a high school level when she graduated from high school. Although Emory and Elaine Carter shared their concerns and wishes with the public school officials, the administrators took a "take it or leave it" position. They refused to provide Shannon with a more intensive special education program where she would receive remediation in reading, writing, and arithmetic. The parents requested a special education due process hearing. The Hearing Officer ruled that the public school IEP was appropriate. The parents appealed this decision to a Review Panel. The Review Panel upheld the decision of the Hearing Officer. At that point,
Emory and Elaine Carter withdrew Shannon from the public school
and enrolled her in Trident Academy in Mt. Pleasant, South Carolina. Trident Academy is a private school that specializes in educating and remediating children with
learning disabilities, including dyslexia. When Shannon
graduated from Trident Academy three years later, her reading and math
scores were on a high school level. After hearing testimony and reviewing the transcripts and documents from the Due Process and Review Hearings, Judge Houck found that the school district's IEP was "wholly inadequate" to meet Shannon's needs. He ruled that Shannon had received an appropriate education at Trident and ordered Florence County to reimburse Shannon's parents for the costs of her education. (Read Judge Houck's decision) On what basis did Judge Houck decide that the IEP proposed by Florence County was inappropriate? What evidence caused him to decide that Shannon received an appropriate education at Trident Academy? The decisions
in Shannon's case, and in most special education cases, are based on the evidence
provided by tests and evaluations of the child. When
Judge Houck wrote that Florence County's IEP was "wholly inadequate"
to meet Shannon's needs, he was relying on test results. Judge Houck knew the importance of accurately interpreting
test scores. He charted Shannon's test scores and included this information in his decision. (See also Hall v. Vance, 555
EHLR 437, (E.D. NC 1983), affirmed at 774 F. 2d 629, 557 EHLR 155, (4th
Cir. 1985)) in which U. S. District Court Judge Dupree charted out James
Hall's test scores to support his decision that Vance County, North
Carolina did not provide James with an appropriate education.) A three judge panel of the Fourth Circuit affirmed Judge Houck's decision about the inadequacy of Florence County's proposed IEP. Florence County then appealed to the United States Supreme Court. On October 6, 1993, Pete Wright argued Shannon's case before the Court. Thirty-four days later, on November 9, 1993, the Supreme Court issued a unanimous favorable decision on Shannon's behalf. In the Carter decision, written by Justice Sandra Day O'Connor, the Court upheld the lower court decisions, ruled against Florence County School District Four, and ordered them to reimburse Shannon's parents for the costs of her tuition, room and board, and attorney's fees. The Individuals with Disabilities Education Act (IDEA) requires IEPs to include measurable annual goals and a description of how the child's progress toward meeting the annual goals will be measured. (III) a description of how the child's progress toward meeting the annual goals described in subclause (II) will be measured and when periodic reports on the progress the child is making toward the annual goals ... will be provided ... (See 20 U.S.C. 1414(d)(1)(A)(i)(II and III; page 99 in Wrightslaw: Special Education Law, 2nd Edition, page 99. See also the "Definition of individualized education program" in the federal special education regulations, Volume 34 of the Code of Federal Regulations, 34 CFR 300.320(a)(2)(i) and (a)(3)(i); page 245 in Wrightslaw: Special Education Law, 2nd Edition) The U. S. District Court and the Fourth Circuit found that the proposed gain of four months after a full year of special education was "wholly inadequate." In an effort to avoid Florence County's fate, many school districts around the country develop IEPs that include no objective measures of the child's progress. Instead of developing goals where the child's progress is measured using objective tests, as Florence County did, many schools now devise IEPs that rely subjective teacher observations of the child's progress. Let's see how this works. Johnny is a child who has a learning disability that is affects his ability to read. In reading, Johnny is below grade level. Instead of developing an IEP that will measure his progress in reading on specific objective tests, the special education staff may write a goal like this: "Johnny will make measurable progress in reading, as measured by teacher observation and teacher made tests at 80% accuracy." In that case, "objective measurement of progress" becomes the teacher's subjective observation about whether her student made progress in reading, writing, or arithmetic. The criteria for determining progress becomes 80% of a subjective belief or opinion. When parents object and request a more intensive program that includes clear objective scores, they are often rebuffed or criticized. In many areas, school board counsel and state departments of education advised schools to stop using objective measurements of progress (tests) to measure progress for special education children. If you believe that the special education your child is receiving is inadequate, you must have evidence to support your position. You will find this evidence in the public school and private sector testing that has been or will be completed on your child. To master the material in this article, you should expect to read the article at least three times. When you take this step, you will know what tests and evaluations measure and how test results are reported. You will know how to convert scores on different tests into numbers that are easily understood. And, you will know how to measure a child's educational progress or lack of progress, i.e. regression. Michael Three years ago, your eight-year-old son Mike began to have serious difficulties in school. By the time he entered third grade, you were deeply concerned about his difficulties in learning to read. His handwriting was nearly illegible. Homework was a nightmare. You consulted with Mike's teacher about these problems several times. Eventually, the teacher sent Mike's "case" to a special education committee. You attended a meeting of this committee. The committee recommended that Mike be evaluated through the school's special education department. Relieved that something would be done to help you child, you consented to these tests. According to the evaluations, your son has a learning disability. In Mike's case, he has visual-perceptual problems and visual-motor problems that negatively affect his ability to read and write. Based on the results of the evaluations, your son was found eligible for special education services at his neighborhood school. After Mike was found eligible for special education, you attended a meeting to develop his Individualized Education Program (IEP). This IEP provided for Mike to receive one period of special education in an "LD Resource" class every day. It was your understanding that Mike would receive individualized help in reading and writing from a teacher who was specially trained to remediate his learning disability problems. Three years have passed. Mike hasn't made much progress, despite the special education help. He still has difficulty reading aloud. His spelling is poor, and his handwriting is unreadable. He is behind most of the children in his class. His attitude has changed. He is angry and depressed and says he "hates school." When you discussed your concerns about Mike's lack of progress with his special education teacher, she reassured you that he was "making progress" and told you to be patient. From your perspective, patience is not the issue. You are worried that your son will never master the basic academic skills. You are worried about his future. At a recent IEP meeting, you reiterated your concerns about Mike's lack of progress and expressed your belief that he needs more help than he is getting in the school's Resource program. The IEP team disagreed with you. One person said that Mike was getting all the help he needs and that he was really doing quite well. Another member said that your expectations were too high --- and if you don't accept Mike's "limitations," you will damage him emotionally. What should
you do? You believe that Mike's new "emotional problems" are caused by shame and embarrassment because he is not successful in school. How can you, a parent, prove this to the staff at Mike's school so that they will develop an appropriate educational program for him? How will you know when he is getting the help he needs? Many parents assume that interpreting their child's test data is beyond their competence, that this is the responsibility of the school personnel. If parents do not accept the responsibility of learning this information, they leave interpreting the test data to the school psychologist. The school psychologist often has very little information about your child, aside from scores on tests administered years ago. The basic principles of tests and measurements are not difficult to learn. As you read this article, you will see that you are already familiar with many of the concepts discussed. Statistics and statistical terms are used in many other areas of life, from business and sports to medicine. Newspaper and magazine articles use statistics to inform readers about change or lack of change. You read articles about changes in the population, the climate, the economy. Even public opinion polls include statistical information to inform you or persuade you of a point. As a parent, you need to expend time and effort to develop a basic understanding of statistics. To accomplish this goal, you should reread parts of this article several times. Underline, make margin notes, and use a highlighter. Be patient and put in the time. The time you spend now will help to change your child's life forever. As you study this material, you are likely to see some terms and concepts that are confusing at first ---terms like standard deviation, standard scores, and grade and age equivalents. Other concepts will be familiar --- averages, percentages. When you master this information, you will understand the educational and psychological
tests administered to your child. You will be able to use this
information to make wise decisions about your child's education. You'll find that your
newfound knowledge and expertise exceeds that of many of the special education
staff and IEP team members. Katie is fourteen years old and in the ninth grade. She "hates school" and is failing several subjects. As a young child, Katie was bright, happy, and curious. When she entered third grade, her attitude began to change. Now, she locks herself in her room, lies on her bed, and listens to music for hours. She is sullen and angry and says she can't wait to quit school. In desperation, Katie's parents took her to a child psychologist for testing. At a meeting to interpret the test results to Katie and her parents, the psychologist explained that Katie scored two "standard deviations" above the mean on the Similarities subtest of the Wechsler Intelligence Test for Children, Fourth Edition (WISC-IV) and two and a half "standard deviations" below the mean on the spontaneous writing sample of the Test of Written Language, Third Edition (TOWL-3). Wrightslaw Note: Test publishers
update and revise their tests fairly often. This article does not focus on any test's strengths or weaknesses, since weaknesses are often corrected in the next edition of that test. Tip: For information about thousands of tests, go to Testlink from the Educational Testing Service (ETS) at http://www.ets.org/test_link/about Parents are often surprised to learn that tests do not necessarily measure what they purport to measure. As you will see, a child's score on a push-up test can be represented as an overall fitness score, a measure of arm strength, an upper body measurement score, a measure of perseveration and persistence, or a measure of a child's motivation. A score may measure only one variable or it may accurately reflect all of the above. Let's look at tests that measure reading ability. One test that purports to measure a child's reading ability actually measures the child's ability to correctly read aloud and pronounce isolated words out of context, i.e., a word recognition test. This test includes a list of words, i.e., cat, tree, dog, house, person, etc. It does not measure reading and may be adversely affected by a child's speech or word finding problems. Another reading
test has the child read a passage of text, then
answer a series of multiple choice questions about the passage. In this
case, the score may be a measure of the child's ability to eliminate certain answers in the multiple choice format, i.e., reasoning, not reading. Some very bright children may need to
recognize and interpret only a few words to discern the total context.
Others have excellent word recognition abilities but cannot link
or interpret the words in a body of text or passage. Tip: You need to know what tests were used and what the tests measure. To learn more about reading tests, read Reading Tests: What They Measure, and Don't Measure by Dr. Melissa Farrall. When we first discussed Katie, we saw that she scored two "standard deviations" above the mean on the Similarities subtest of the Wechsler Intelligence Test for Children, Fourth Edition (WISC-IV) and two and a half "standard deviations" below the mean on the spontaneous writing sample of the Test of Written Language, Third Edition (TOWL-3). Do these
test scores explain the academic problems Katie is having? Do they have
anything to do with her moodiness and her intense dislike of school? (Answers:
Yes and Yes.) To clarify
these points, let's change the facts. You can measure your child's physical
growth with a measuring tape and a bathroom scale. You can measure growth
by charting how much height increases, as measured in inches, and how
much weight increases, as measured by pounds, over a period of months
or years. Using these tools, you can document his physical growth. You
don't need to be a doctor to understand that increases in these measurements
prove that your child is growing.
Assume that
your child's height was five feet, three inches last year. This year,
the child is five feet, six inches tall. You can report this information
in several ways. You can say that last year, your child was sixty-three
inches tall and is now sixty-six inches tall. Or, you can say that your
child was 5.25 feet tall and is now five and a half feet tall. You can
even say that a year ago, your child was 160 centimeters tall and is now
168 centimeters tall. Or, that your child was 1.75 yards tall and is now
1.83 yards tall!
If you or
your child's pediatrician have measured your child's height and weight at regular intervals,
you can create a chart or graph that documents changes in height or weight
over time. Your child's pediatrician has growth charts you can
use to compare your child's growth with the growth of the "average" child.
Academic or educational growth can be measured and charted too. The yardsticks used for
measurement are different, but the principles are the same. Measuring
educational growth or progress is not much different from measuring physical
growth. Instead of a tape measure and scales, you need
the psychological and educational achievement test results. Where will you
find the information you need? How can you measure change?
Most school
districts test their students on standardized educational achievement
tests at regular intervals. The results of these tests provide information
about how well the school district is accomplishing the mission of educating
children. The information contained in group standardized tests can
provide you with some basic information.
Standardized
educational achievement tests are general measures. The information they
provide is similar to that provided by medical screening tests. Medical
screening tests can suggest that a problem exists. In most cases, additional testing
is necessary before the problem can be accurately identified and
a treatment plan developed. Children's learning problems are identified
in a similar manner. In most schools, individual ability
and achievement tests that identify academic or functional problems are administered by
school psychologists and educational diagnosticians.
As you continue
on your advocacy journey, you need to understand the exact nature of your
child's disabling condition(s). How does the disability affect her? In
what areas? How serious is it? What are her strengths and weaknesses?
Does she need special education? What educational issues need to be addressed?
How will you know if she is making progress? How much progress is sufficient?
Many parents
believe they cannot understand these tests. Usually, their reasoning goes like this:
or
The people
who did that testing on my kid went to school for years to learn how
to do that. Who am I to think I can understand it? I'm not a psychologist! Statistics
are simply ways to measure things and to describe relationships between
things, using numbers. Part of the confusion that many people experience
when they begin to learn statistics is because of the terms and concepts are unfamiliar. As we learned in the earlier discussion about measuring
physical growth, there are several ways to report the same information
(inches, feet, yards, centimeters, etc.) This can be confusing.
First, let's
look at a familiar situation that many of us deal with regularly ---
how to measure our car's gas mileage. Remember: When we use statistics,
we can use several terms to describe the same concept. If you
want to describe your car's gas mileage, you can make any of the following
statements:
When you have this
information, you can make decisions. When will you need to buy
more gas? You know that your car has a 15 gallon gas tank. According
to the gas gauge, your tank is slightly below the halfway mark. You've
been driving in the city. You'll be driving on the highway for the rest
of your trip. You have used a precise amount of gas and have a precise
amount of gas left in your tank. You can describe and define this information
in several ways --- gallons used, gallons remaining, miles driven, miles
to go, percentage full, and so forth. Using this information, you
can do some simple math calculations to learn that your car averages
between 17 to 23 miles to a gallon of gas, depending
on driving conditions.
Using this
information or data, you can also measure change. If you
compare your car's present or current mileage to the mileage you obtained
last month, before you had your car tuned up, you can measure miles per
gallon before and after the tune-up. In this way, you can measure the
impact of the tune-up on your car's gas consumption. You can also compare
your car's mileage performance to that of other vehicles.
Let's look
at another common way in which we use tests and measurements. When you
last visited your doctor, you mentioned that you were feeling tired and
sluggish. Your doctor asked several questions, then recommended that you
have some lab work. After reviewing the test results, the doctor explained
that your blood glucose level was moderately elevated.
To lower
your blood glucose level, the doctor recommended a plan of treatment that
included a special diet and a daily program of moderate exercise. After
a month, you return for a follow-up visit. More lab work is completed.
If your glucose level has returned to normal, it is unlikely that you
will require additional treatment. But, if your glucose level remains
high despite the diet and exercise program, you may need more intensive
treatment. By measuring change after an intervention with "data based documentation of repeated assessments ... at reasonable intervals, reflecting formal assessment of progress" (34 C.F.R. 300.309(b)(2), you and your doctor
can make rational decisions about your medical treatment.
Remember:
The principles that allow you to compute your car's gas mileage and make
medical decisions will also allow you to measure and monitor educational progress.
When you measure educational progress (as when you measure your gas
mileage and blood levels), the test scores can be reported and compared
in several different ways. Because educational
test scores are often reported in different formats and compared in different
ways, it is essential for parents and advocates to understand all
of the scoring methods used in measuring and evaluating educational progress,
including:
Let's look at the performance of a group of children. You need to understand
how an individual child scores when compared with other children who are
his age or in his grade --- and what this means.
First, we'll examine a single component of physical fitness in a group of elementary
school students. Our group or sample consists of 100 fifth grade
students. These children are enrolled in a physical fitness class to prepare
them to take the President's Physical Fitness Challenge. We will assume
that the average chronological age (CA) of these children is exactly
ten years, zero months. (CA=10-0) The children are tested in September,
at the beginning of the school year.
To qualify
as "physically fit," each child must meet several goals. Push-ups are
one measure of upper body strength. Each child must complete as many push-ups
as possible in a period of time. Each child's raw score is the
number of push-ups completed. The term raw score is simply another
way of describing the number of items correctly answered or performed.
After all
fifth grade students complete the push-up test, their scores are
listed. The results are as follows:
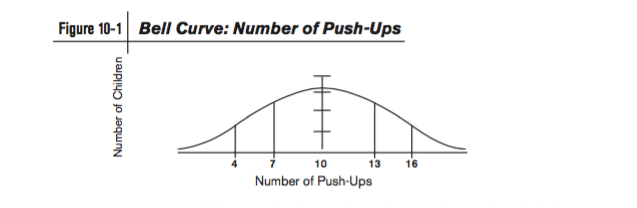
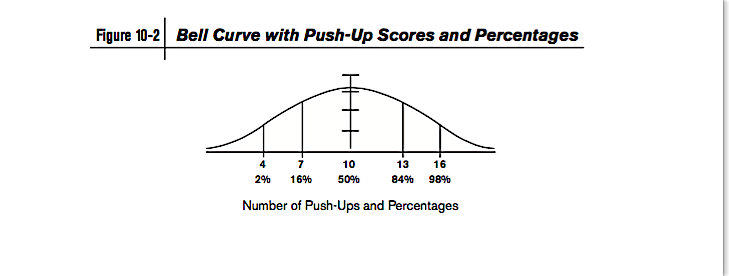
Again, two-thirds
of the children in this fifth grade class were able to complete between
7 and 13 push-ups. The remaining third of the children did fewer than
7 or more than 13 push-ups. Nearly all of the children --- 98 out of 100
--- were able to complete between 4 and 16 push-ups. Click
here to view the bell curve chart. The test
results provide us with a sample of data. As we analyze the data
in our sample, we can compare the performance of any individual child
with that of the entire group. As we make these comparisons, the data
will enable us to recognize any child's strengths and weaknesses
when compared with the peer group of similar youngsters. If we conduct
an identical push-up test with children in other grades, we can compare
our original group of 100 fifth grade children with other groups of youngsters
--- children who are older, younger, in different grades, in different
schools. If we gather enough information or data from other sources, we
can compare our original group of fifth graders --- or an individual child
within our group --- to a national population of children who are being
tested for their upper body strength as measured by their ability to do
push-ups.
In nature,
traits and characteristics distribute themselves along theoretical curves.
For our purposes, the most important curve is called the normal frequency
distribution or bell curve. Because the percentages along
the bell curve are well-known and thoroughly researched, they become our
frame of reference.
By using
the bell curve, we can develop a diagram or graph of the children's
push-up scores. This map --- on the bell curve --- provides us with additional
information. We can see what percentage of children were able to complete
specific numbers of push-ups. When we use the bell curve, we can visually
demonstrate where any particular child scores, when compared with other
children who are the same age or in the same grade. Likewise, with educational
test scores, we can visually demonstrate scores and change over time.
If we compare
the push-up scores obtained by children who attend different schools,
we can determine whether the physical fitness of children, as measured
by their ability to do push-ups, varies in different schools, neighborhoods,
states, or countries.
We can also
measure progress over time --- with push-ups and with improvement in reading
skills. Let's look at our class of fifth graders again. We want to gather
information as to whether the physical fitness class is effective ---
whether the children's fitness levels improve. How can we answer this
question?
To measure
the effectiveness of the fitness class, we will measure the children's
number of push-ups before they take the class and compare this
score with their score after they take the class. If the class
is effective, we should see individual improvement and group improvement.
Some children will have minimal improvement --- these children will fall
further behind the peer group. Other children who performed below their
peers may show significant improvement. Some children will improve so
much that they now perform as well or better than the "average" youngster.
We will measure
the children's progress on one or more occasions as they progress through
the class. If the fitness class is "working," that is, if the children's'
fitness levels are improving, their ability to perform fitness skills
should improve measurably over time. In our example, physical fitness
improvement is being measured with "technically sound instruments" that "are valid and reliable" (34 C.F.R. §300.404(b)(c)) and use "Data-based documentation of repeated assessments of achievement at reasonable intervals, reflecting formal assessment of student progress ..." (34 C.F.R. §300.309(b)(2))
Because of
its value and usefulness in measuring educational progress, we will return
to the subject of the bell curve repeatedly throughout this article.
On all bell
curves, the bottom or horizontal line is called the X axis. In
our sample of fifth graders, the X axis represents "number of push-ups."
And, on all bell curves, the up- and- down vertical line is called the
Y axis. In our sample, the Y axis represents the number of children
who earned a specific score (number of push-ups completed). As you can
see in the diagram above, the highest point of the bell curve on the
X axis is equal to a score of 10 push-ups. You recall that more children completed
10 push-ups than any other number. Thus, the highest point on this bell
curve represents a score of 10. The next most frequently obtained scores
were 9 and 11, followed by 8 and 12. This pattern continues out toward
the far ends of the bell curve. In our example, the ends occurred
at 1 and 19 push-ups.
Using the
bell curve, we can now chart each child's score and compare it to the
score achieved by all 100 students in the class. Look at the bell curve
above, and find 10 push-ups. We know that Amy completed 10 push-ups so
her raw score was 10. Ten push-ups placed her squarely in the middle of
the class. Half of the youngsters in Amy's class earned a score of 10
or more; half of the children scored 10 or less. If you look at the bell
curve diagram (below), you see that Amy's score of 10 placed her at the
50% level. The individual's percent level is referred to as their percentile
rank (PR). Amy's percentile rank is 50 (PR=50). Erik completed
13 push-ups. Looking at the bell curve above, you see that his score
of 13 placed him at the 84th percent level. Erik's percentile rank
is 84 (PR=84). Erik's ability to do push-ups placed him in the 84th position
out of the 100 fifth grade children tested on upper body
strength.
Sam completed
7 push-ups. His raw score of 7 placed him at the (bottom) 16 percent.
Sam's percentile rank was 16 (PR=16). Out of our sample of 100 fifth grade
children, 84 children earned a higher score than Sam.
Larry completed
6 push-ups. We can convert his raw score of 6 to a percentile rank of
9 (PR=9). 91 children scored higher and 8 children scored lower than Larry
in upper body strength as measured by the ability to do push-ups.
Oscar completed
2 push-ups. His raw score of 2 placed him in the bottom 1 percent of fifth
graders tested (PR=1).
Nancy's raw
score of 17 placed her at the upper 99 percent. We say that Nancy scored
at the 99th percentile rank (PR=99).
You can see
the relationship between the number of push-ups completed and the child's
percentile rank (PR) reproduced in the table below: Click
here to see the table
The bell
curve is a powerful tool. When you use the bell curve, you can objectively
compare any child's percentile rank to that of a group of children. You
can also compare a single child's progress or regression when compared
to the group.
Using the
bell curve, you can compare a single child's score to the scores obtained
by other children who are older or younger or in different grades.
Let's see
how this works. Again, we will measure the children's upper body strength
by the number of push-ups they can perform. In this case, we decide to
evaluate all children in all the elementary grades, from Kindergarten
through fifth grade. We will assume that the average chronological age
of these elementary school children is exactly eight years (CA=8-0 years).
After we
test the third graders, we find that the average or mean
score of our sample of 100 eight year old third graders is 6 push-ups.
This means that the "average" third grade child (who is 8 years old) can
do 6 push-ups. We can also compare an individual child's score on arithmetic
problems answered correctly with the average number answered correctly
by children the same age.
How can we
compare children from different groups? Let's look at Larry who was a
member of our original group of fifth graders. Although the average fifth
grader performed 10 push-ups, Larry only completed 6 push-ups. His raw
score of 6 converts to a percentile rank of nine (PR=9).
When we compare
Larry's performance to all elementary school students, we learn that Larry
(a fifth grader) is functioning at the level of the average third
grader --- who is also eight years old --- in the ability to do push-ups.
Therefore, we see that Larry's age equivalent score is 8 years
(AE=8-0) and his grade equivalent score is at the third grade level
(GE=3-0). Look again
at the table of scores above and find Frank's name. You see that Frank
earned a raw score of 15 push-ups which converts to a percentile rank
of 95 (PR=95). Frank's score looks great --- until we remember that Frank
was "held back" three times. Although he is in the fifth grade, Frank
is 13 years old!
With this
new information, let's take another look at Franks' performance. The average
score for 8th graders (who are 13 years old) is 15. Frank scored 15. Frank
had a grade equivalent score of 8th grade (GE = 8.0) and an age
equivalent score of 13 years (AE = 13-0). When we compare Frank
with other children in his expected grade, we see that his achievement
is in the average range. Frank is in the 95th percentile level when compared
to fifth graders, not when compared to eighth graders.
Frank's case
brings up some additional questions. Frank (age 13) was included in our
sample of 5 th graders who had an average age of 10. When compared to
this group of children who were younger than him, Frank scored at the
95% percentile rank (PR) level. Question: If we compare Frank's
performance to that of children who are three years younger than him,
will this comparison provide us with an accurate picture of his physical
fitness? Answer: No.
In Frank's
case, statistics inform us of two facts. First, we see that Frank performs
at a superior level when compared with other children in his grade.
Second, we see that he performs at an average level when compared with
children who are his age.
When you
evaluate the significance of data from tests, you must know how the
scores are being reported. Test scores can be reported using percentile
ranks, age equivalents, grade equivalents, raw scores, scale scores, subtest
scores, or standard scores.
Remember:
Although Frank's performance was superior for his grade,
it was average for his age. If you did not know Frank's
age and grade, you would have been misled as to Frank's actual
achievement. But --- if Frank was an 8 year old 3rd grader, his scores
would be in the superior range, using both age equivalent and grade
equivalent measures.
The number
of push-ups each child completed was his or her raw score. Let's
assume that we want to obtain an overall fitness score. To obtain an overall
or composite score, we will measure three skills (sit-ups, push-ups,
a timed 50 yard dash) and obtain scores on each of these skills. In educational
testing, the child's overall score (in reading, math, etc.) is often a
composite of several subtest scores.
Next, we
will develop a weighting system that will convert each child's raw
score to a scale score. After we convert the raw scores to scale
scores, we will be able to compare each of the three scores to each other
(number of push-ups, number of sit-ups, seconds to complete the 50 yard
dash). How do we convert raw scores into scale scores?
One way to
convert scores is by developing a rank order system. In rank order
scoring, the child who scores highest in an event (most push-ups, most
sit-ups, fastest run) receives a scale score of 100; the lowest
receives a score of 1. The other 98 children receive their respective
"rank" as their scale score.
After each
child's raw scores are converted to scale scores, we can easily compare
an individual child to the group and to all children who are the same
age or in the same grade. We can also compare an individual child's performance
at different times, i.e. before and after completing the fitness course.
Was the child able to do significantly more push-ups after taking the
fitness course? Was the child reading better after receiving reading remediation?
You can see
that after we develop a global composite score, the individual
child's raw scores on each of the three fitness subtests have less
significance. This is exactly what happens with educational achievement
and psychological tests. Most educational tests are composites of several
subtests; the subtest scores are combined to develop composite scores.
More about this shortly.
Let's look
at how composite scores can be used and some of the problems that arise
when we rely on them.
John is a
member of our original group of 100 fifth graders. He has good muscular
strength (he scored at the 70% PR level in push-ups and at the 78% PR
in sit-ups). But, John is very slow and uncoordinated. In the 50 yard
dash, he finished 2nd from the last out of the 100 children (PR=2).
How will
John's composite fitness score be derived? In this example, we will average
John's percentile rank scores on the three events. John's composite score
is determined as follows: Add the percentile ranks of each event (70 +
78 + 2 = 150), then divide this score by the number of events (3). In
John's case, 150 / 3 = 50. (Note: actually it is improper to average
the percentile rank scores, you must use the standard scores or scale
/ subtest scores.)
John's composite
score is 50. This composite percentile rank score of 50 places
him squarely in the "average" range. Is John an "average" child? His individual
scores demonstrated a significant amount of subtest scatter. When
you analyze his three subtest scores, you see that he has specific strengths
and a very severe deficiency. Despite his average composite score, John
is not an average child! (Note: As noted above, the proper calculation
is to use the standard scores. Thus the same analysis of John's composite
score by using standard scores, is calculated to a standard score
of 96.5 and percentile rank of 41 --- again, John appears to be an average
child).
Let's look
at another example of composite scores to see how they can mislead us.
Oscar was at the 1 percent level in push-ups. But when the other fitness
subtests were given, Oscar was the fastest child in the class scoring
at the 99% level. He was average in sit-ups, scoring at the 50% level.
Oscar's composite fitness score, using percentile ranking, is 50%. Is
Oscar really an average child? Would he benefit from remediation to improve
his upper body strength, as measured by push-ups? Oscar also a great deal
of subtest scatter, i.e., from extremely weak upper body strength
to superior speed.
When subtest
scores vary a great deal, this is called subtest scatter. If significant
scatter exists, this suggests that the child has areas of strength and
weakness that need to be explored.
How can you
determine if significant subtest scatter is present? Most subtests
have a mean score of 10. Most children will score + or - 3 points
away from the mean of 10, i.e. most children will score between 7 and
13.
If the mean
on a subtest is 10 (and most children score between 7 and 13), then scores
between 9 and 11 will represent minimal subtest scatter. Lets assume that
Child A is given a test that is composed of 10 subtests. The child's scores
on the 10 subtests are as follows: on 4 subtests, the child scores 10,
on 3 subtests, the child scores 9, and on 3 subtests, the child scores
11. In this case, the overall composite score is 10 and the scatter is
very minimal. This child scored in the average range in all 10 subtests.
In our next
example, we will assume that Child B earns 4 subtest scores of 10, 3 scores
of 4, and 3 scores of 16. The child did extremely well on 3 tests, very
poorly on 3 tests, and average on 4 subtests. Again, the child's composite
score would be 10. Subtest scatter is the difference between the highest
and lowest scores. In this case, subtest scatter would be 12 (16-4
= 12) Is this an "average" child? Because the child's scores demonstrate
very significant subtest scatter, we need to know more about these weak
and strong areas.
In educational
situations, it is essential that parents understand the nature of the
weak areas, what skills need to be learned to strengthen those areas,
and how the strong areas can be used to help remediate the child's weak
areas. The spread or variability between the subtest scores is called
subtest scatter.
Apply Your Knowledge: Composite Scores & Subtest Scatter How do composite scores and subtest scatter relate to the information
contained in your child's evaluations? The results
of educational tests given to children are often provided in composite
scores. Remember: A Full Scale IQ score is a composite of four Index Scores (VCI, PRI, WMI, and PSI). When you look at Katie's scores, you see that she has significant subtest scatter, from a high of 16 on the Similarities subtest (98th percentile) to a low score of 4 on Coding (2nd percentile). By using the Conversion Table below, you can convert the rest of her subtest scores. If we rely
on composite Index Scores or Full Scale IQ scores, we may easily be misled, with serious consequences. If we did not examine the subtest scores and Index Scores, we might view Katie as an "average" child - and we would be mistaken. Woodcock-Johnson Tests of Achievement (WJ-III ACH)
One of the
most commonly administered individual educational achievement tests
is the Woodcock Johnson III Tests of Achievement (WJ-III ACH).
The Woodcock-Johnson III Tests of Achievement include two batteries, a standard battery and an extended battery. Subtests are organized into clusters. One concern that many parents share is the belief that their child
is not making adequate progress in a special education program. How can
parents know if their perception is accurate? How can parents
persuade school officials that the special education program being provided
needs to be changed?
Earlier in
this article, we discussed how statistics are used in medical treatment
planning. We demonstrated how a medical problem is identified and the
efficacy of treatment is measured by the use of objective tests. In our example,
the patient had pre- and post- testing to determine if the intervention was working. Based on post test results, more medical decisions would be made --- to continue, terminate, or change
the treatment plan.
This practice
of measuring change, called pre- and post- testing, is essential to educational planning. The child's levels of performance are measured. An educational plan (IEP) is developed and implemented. The child is re-tested at set intervals to determine if the child is progressing, regressing,
or maintaining the same position within the group (stagnating). To see how
this works, let's visit our fifth grade fitness class. According to
earlier testing in September, Erik completed 13 push-ups which placed
him in the 84th percentile of all youngsters in his class. After a year
of fitness training, fifth graders were re-tested. When
Erik was re-tested, he completed 14 push-ups.
What about
Sam? Sam's performance also improved, from a raw score of 7 to
8. Although Sam's age equivalent and grade equivalent scores
increased slightly, he also regressed. He dropped from the 16th percentile to the 9th percentile. Sam continues to fall further behind the peer group.
Assume that we test Sam again, when he re-enters school in the fall. Now, we have
three sets of test data (beginning 5th grade, end 5th grade, beginning
6th grade). Did Sam's score change? If his percentile continues
to fall, Sam continues to regress. We need to know how long will
it take for Sam to recoup the skills he lost during the summer. Regression
and recoupment are two of the issues considered when determining if the child needs Extended School Year (ESY) services during the summer.
Most standardized
tests are norm referenced or criterion referenced.
When we evaluated
our group of fifth graders, we compared each child's performance
to the norm group of fifth graders. Both Erik (raw score of 13,
percentile rank of 84) and Sam (raw score of 7, percentile rank of 16)
were compared to this norm group of fifth graders.
To evaluate benefit, we looked at the norm group and the individual child's
position in that group when we administered the first and second tests.
We computed each child's change in position to determine progress or regression.
In our example,
we also referenced the criteria of number of push-ups completed.
A criterion reference analysis determines whether or not a child
meets certain criteria (without reference to a norm group.) For example,
at the beginning of the year, Sam completed 7 push-ups. If the criteria
for success was 8 push-ups, Sam failed to reach that goal. Assume that Sam received a year of physical fitness remediation. After that year, Sam completed 8 push-ups. Does Sam met the criteria
for success? The answer to this question depends on whether the criteria
increased because Sam is a year older.
Another factor
complicates this picture. We know that Sam's' peer group completed 10
push-ups at the beginning of the year and 12 push-ups at the end of the year. Definitions
of success are affected by the passage of time. If we rely on criterion
referenced measures, we can be misled as to whether the child is falling
further behind the peer group. We need to know exactly what the criterion
is and what this means when the child is compared to a norm group.
Percentile
ranks are computed by determining the mean score and the amount
of variation of all scores around the mean score. Are the scores
bunched around the number 10 in a tight uniform distribution? Are the
scores evenly distributed? Do they peak and taper slowly, or do they bunch at the ends, without few or no scores in the middle?
Is there a great variance, with the scores spread
over a wide range, with two or more peaks? Is there a normal bell curve
distribution of scores?
On our push-up
test, most of the 5th graders earned scores around 10 push-ups,
with an even distribution above and below 10 push-ups. If one-half
of the children completed 5 push-ups, one-fourth completed 14
push-ups, and one-fourth completed 16 push-ups, the
average or mean number of push-ups would still be 10! One-half of the
children scored above 10 and one-half below 10.
In this case,
the scores are not evenly distributed in a smooth curve above and
below the mean score of 10. The variance is very large and would present
a very unusual curve with a peak at 5, a drop to zero between 6 and
13, a jump at 14, a drop at 15, another jump at 16. This distribution
of scores would not present a normal bell curve distribution. In all tests,
the mean is 0 (zero) standard deviations from the mean. The next marker
on the bell curve is +1 and -1 standard deviations from the mean, followed
by 2 standard deviations from the mean. To interpret your child's test
scores, you need to know the mean and standard deviation.
Using our
original push-up example, the mean was 10 push-ups. The standard deviation (SD) was 3 push-ups. This push-up example is
identical to the subtest scores in almost all standardized educational
and psychological testing.
One standard
deviation above the mean is 10 plus 3, i.e. 10 + 3 = 13. One standard
deviation below the mean is 10 minus 3; i.e. 10 - 3 = 7. One standard
deviation above the mean always falls at the 84 percentile (PR = 84);
one standard deviation below the mean is always at the 16 percentile
(PR = 16). Two SD's above the mean is always at the 98 percentile (PR
= 98); and two SD's below the mean are always at the 2nd percentile(PR
= 2). When we look at actual test scores, we see that the child scored "one standard deviation
below the mean" on a particular test or subtest. If the score is one standard
deviation below the mean, the child's percentile rank is 16.
REMEMBER:
Most subtests have a mean of
10 and standard deviation of 3. If a child scores 7 on a subtest, this score is at the 16th percentile. A subtest score of
13 is at the 84th percentile.
One of the
most difficult concepts for most people to grasp is standard
scores. Since educational test scores are usually provided in standard scores,
parents must know what they mean.
At an IEP
meeting, a parent is told that the child earned a standard score of
85 in one area, a standard score of 70 in another area. Most parents are
relieved to hear this news. Why? Most parents believe these numbers
are similar to grades, with 100 as the highest score and 0 as the lowest. Standard scores are NOT like grades.
With standard
scores, the average score or mean is 100. The standard
deviation is 15. The average child earns a standard score of 100.
If a child scores 1 standard deviation above the mean, the standard score
is 100 plus 15; i.e. 100 + 15 = 115. If the child scores 1 standard deviation
below the mean, this is 100 minus 15, i.e. 100 - 15 = 85.
A standard
score of 115 is 1 standard deviation above the mean so it is always
at the 84th percentile. A standard score of 85 is 1 standard deviation
below the mean so it is always at the 16th percentile. A standard
score of 130 (+2 SD) is always at the 98th percentile. A standard
score of 70 (-2 SD) is always at the 2nd percentile.
Remember
Katie? Earlier, we learned that on the Wechsler Intelligence Scale, Katie
earned a Full Scale IQ of 101. Later, we realized that this score was misleading
because Katie's Verbal Comprehension Index Score (VCI) was 124, while her Perceptual Reasoning Index Score
(PRI) was 88. The psychologist found that Katie scored 2 standard deviations
above the mean on the Similarities subtest of the Wechsler Intelligence
Scale for Children, 4th Edition (WISC-IV). What does this mean?
You learned that a score of 2 standard deviations above the mean places the child
at the 98th percentile in the area being measured. Since the Similarities
subtest of the WISC-IV measures verbal reasoning ability, Katie's
verbal reasoning power is at the 98 percentile.
The psychologist
also found that Katie had a standard score of 68, 2.5 standard
deviations below the mean, on the spontaneous writing sample
of the Test of Written Language (TOWL-3). Two SD's below the mean is
at the 2nd percentile. With your new knowledge, you know that Katie's
ability to produce spontaneous writing samples was actually below the 1st percentile.
When we first
introduced Katie, we posed two questions:
1. Do these
two test scores help to explain the academic problems Katie is having?
2. Do her
test scores tell us anything about her moodiness and her intense dislike
of school?
Katie's verbal reasoning ability places her at the 98th percentile of youngsters her
age. However, her ability to convey her thoughts in writing is below the
1st percentile. Katie is very bright but she is unable to convey her
knowledge to her teachers on written assignments and tests. Would you expect her to feel frustrated and stupid? Do you question why, after years
of frustration, Katie is angry, depressed and now wants to quit school? All educational
and psychological tests that report scores using percentile ranks or standard
scores are based on the bell curve. To interpret tests results, you
must know the mean and the standard deviation. Most standardized tests use a mean of 100 and a standard deviation of 15.
The results of most educational tests are reported as standard scores. Parents must learn how to convert standard scores into percentile ranks. By using the conversion table and the bell curve, you can convert any standard score into a percentile rank. The earlier push-up example used standard scores. Click here to view the table
Means and Standard Deviations of Other Tests
With some tests, scores are reported
differently. For example, test scores may be reported as "z scores."
Z scores are have a mean of 0 (zero) and and standard deviation of 1 (Mean = 0, SD = 1)
If you know
that a child earned a z score of -1, you know that
the child scored one standard deviation below the mean. One standard deviation below the mean is at the 16th percentile. If you convert this score into the standard
score format, with a mean of 100 and a standard deviation of 15, a z score of -1 is the same as a standard score of 85.
Other tests report results as T Scores. T scores have a mean of 50 and a standard deviation of 10 (Mean =50; SD=10). A T score of 60 is the same as a
z score of +1. A child who has a T score of 60 or a Z score of +1 scored at the 84th percentile
rank. A T score of 70 is the same as a z score of +2, a standard score
of 130, and a percentile rank of 98.
A few tests report results in Stanines. In Stanine tests, the mean is five and the standard
deviation is 2 (Mean = 5; SD=2). Since tests
are always in a state of change with new editions being published, we will
not attempt to review and describe tests in this article. Please check the links at the end of this article for test information.
Earlier, you learned that Index Scores are actually composites or averages of two or three different subtests. Each subtest measures different abilities. Let's take look at
Katie's subtest scores to see what we can learn from them.
When we presented Katie's test results, you learned that variation among subtest scores (subtest scatter) is a valuable source of information. Look at Katie's WISC-IV Index and subtest scores in the table above. You can see that she has significant
subtest scatter, from a high score of 16 on Similarities (98th percentile) to a
low score of 4 on Coding (2nd percentile).
Subtests of the WISC-IV range from a low score of 1 to a high score of 19. WISC-IV subtest scores have a mean of 10 and a standard deviation of 3. A subtest score of 7 is one standard deviation below the mean (-1 SD). By using the Conversion Table, you can convert the subtest score of 7 to a percentile rank of 16 (PR = 16). You can also convert the subtest score of 7 to a standard score of 85.
You need to understand what subtests measure. When we first discussed
Katie's test scores, you learned that Similarities subtest is highly correlated
with abstract reasoning. The Coding subtest measures Subtests of the Wechsler Intelligence Scale for Children-IV (WISC-IV)
The WISC-IV Technical and Interpretive Manual describes the WISC-IV subtests as follows: Psycho-Educational Evaluations by Evaluators in the Private Sector
We find that public school evaluators are often limited in the tests that are available for their use. Heavy workloads may prevent them from completing a comprehensive evaluation of a child. As a result, we do not rely on testing by public school employees. Instead, we have the child evaluated by a child psychologist, school psychologist, speech language pathologist, and/or educational diagnostician in the private sector. When you use this article and Wrightslaw: Special Education Law, Second Edition, you will be able to write IEP's that include measurable goals.
After you master the information in this article, you will be able to convert test scores into easily understood numbers. You will be able to measure and monitor your child's educational progress. The feelings of helplessness and confusion you have experienced at school meetings will dissipate. You will be knowledgeable about your child's test scores and the significance of the data. 2.
Begin your list with the test or tests that have been administered most
frequently. In many cases, that will be the Wechsler Intelligence Test
and the Woodcock-Johnson and/or Kaufmann Educational Achievement Tests.
3. Write
down all of the scores from the first administration of a test battery.
Convert these scores to percentile ranks. Complete the same process
with the most recent testing of the same battery. Compare the results.
You should be able to determine whether your child is being remediated
(catching up), staying in the same position, or falling further behind
the peer group.
4. Dig
for the standard scores or percentile rank scores in your child's file.
You may find that some scores are only reported in "ranges" (i.e., high-
average, low-average) or in grade equivalent or age equivalent scores.
If the standard scores are not available, you should ask for them. When
you request the data in standard score format, the school staff may
be surprised but they should be able to comply with your request.
5. Take
the most glaring deficiencies where your child has shown minimal progress
or even regression and chart out the test results. If you do not have
a computer, use graph paper. Software programs like Excel and PowerPoint
allow for dramatic visual presentations of test data. If this is too
difficult or confusing, consult with an expert. 6.
Ask the professional to use the bell curve chart that includes standard
scores, standard deviations and percentile ranks. Be sure that you have
a photocopy of the bell curve so you can take it home to study. If the
professional is willing, it may be helpful to tape record this portion
of the session so that you can go back over it at home with the test
scores in front of you.
7.
Contact your state's Department of Education and request all publications
about special education and IEPs, along with your state regulations.
8. Download
our companion article, "Your
Child's IEP: Practical and Legal Guidance for Parents and Advocates."
For information
about thousands of tests, go to Testlink from the Educational Testing Service (ETS) at For unparalleled expertise and wit on testing, visit the website published by John Willis and Ron Dumont at http://alpha.fdu.edu/~dumont/psychology/. The site includes includes Test Reviews and Commentary and Psycho-Educational Reports and Report Critiques.
Bell Curve Charts & Percentile Rank / Standard Scores Conversion Charts Don't forget to download Your Child's IEP: Practical and Legal Guidance for Parents and Advocates. Wrightslaw: From Emotions to Advocacy, 2nd Edition - Chapters 10 and 11 teach you about tests and measurements and how to measure progress objectively. From Emotions to Advocacy includes bell curves, charts, graphs, and other visual aides to help you master this subject. Wrightslaw: All About Tests and Assessments by Melissa Lee Farrall, Ph.D., SAIF, Pamela Darr Wright, MA, MSW, and Peter W.D. Wright, Esq. answers more than 200 questions about the assessment process. You will learn what to expect, how to prepare, and how to find a good evaluator. Learn how to request an evaluation and how to provide parental consent. You will find charts of tests and skills. The charts list tests to evaluate specific problems, the skills your child needs in these areas, and shows which tests measure these skills. Back to Top Pam Wright is a psychotherapist who has worked with children and families since the early 1970’s.
Her training and experience in clinical psychology and clinical social work give her a unique perspective on parent-child-school dynamics, problems, and solutions.
She is the co-author of Wrightslaw: Special Education Law, 2nd Edition (2007), Wrightslaw: No Child Left Behind (2003), Wrightslaw: IDEA 2004 (2005), and Wrightslaw: From Emotions to Advocacy, 2nd Edition (2005). Pam is also the editor of The Special Ed Advocate newsletter. This article was originally published in 1998. It has been revise several times, most recently in January 2022.
Copyright � 1998-2026, Peter W. D. Wright and Pamela Darr
Wright. All rights reserved.
Contact Us |
Press l Mission l Our Awards l
Privacy
Policy l
Disclaimer l
Site Map |
|||||||||||||||||||||||||||||||||||||||||||||||||||||||||||||||||||||||||||||||||||||||||||||||||||||||||
|
|
||||
| Push-ups | Percentile Rank | Push-ups | Percentile Rank | |
| 19 | 99 | 9 | 37 | |
| 18 | 99 | 8 | 25 | |
| 17 | 99 | 7 | 16 | |
| 16 | 98 | 6 | 9 | |
| 15 | 95 | 5 | 5 | |
| 14 | 91 | 4 | 2 | |
| 13 | 84 | 3 | 1 | |
| 12 | 75 | 2 | 1 | |
| 11 | 63 | 1 | 1 | |
| 10 | 50 |
|
||
| Standard
Score |
Subtest
Score |
%
Rank |
Standard Score |
Subtest
Score |
%
Rank |
Standard Score |
Subtest
Score |
%
Rank |
Standard Score |
Subtest
Score |
%
Rank |
| 145 | 19 | >99 | 107 | -- | 68 | 97 | -- | 42 | 87 | -- | 19 |
| 140 | 18 | >99 | 106 | -- | 66 | 96 | -- | 39 | 86 | -- | 18 |
| 135 | 17 | 99 | 105 | 11 | 63 | 95 | 9 | 37 | 85 | 7 | 16 |
| 130 | 16 | 98 | 104 | -- | 61 | 94 | -- | 34 | 80 | 6 | 9 |
| 125 | 15 | 95 | 103 | -- | 58 | 93 | -- | 32 | 75 | 5 | 5 |
| 120 | 14 | 91 | 102 | -- | 55 | 92 | -- | 30 | 70 | 4 | 2 |
| 115 | 13 | 84 | 101 | -- | 53 | 91 | -- | 27 | 65 | 3 | 1 |
| 110 | 12 | 75 | 100 | -- | 50 | 90 | 8 | 25 | 60 | 2 | <1 |
| 109 | -- | 73 | 99 | -- | 47 | 89 | -- | 23 | 55 | 1 | >1 |
| 108 | -- | 70 | 98 | -- | 45 | 88 | -- | 21 | Back to Katie's Scores | Back to Quick Rules |